
Data patterns and true leading indicators. (4 minutes)
Take notes while you listen. You can add to the discussion or contact Lynn in the Forum.
Analytics inspire managers to engage
Examples of Outcome Data:
Behavioral data: their actions on websites and in stores, their engagement in offers, etc.
Intention data: their answers to “likely to ____” questions, etc.
Examples of Operational Data:
Website data and app data: heat maps, session replays, etc.
CRM data, manufacturing order data, delivery data.
Customer acquisition cost (CAC), cost per acquisition (CPA), margin expansion, sales velocity, etc.
Retention rate, churn rate, renewal rate, referral rate.
Share of wallet (B2C) or share of budget (B2B), lifetime value, etc.
SaaS utilization rates of key features, their onboarding time, their time to value, etc.
Service data: first contact resolution (FCR), average handle time (AHT), transfer rate, service level agreement (SLA; e.g. X% calls answered in Y seconds), total hold time, total talk time, etc.
All of the above are lagging indicators.
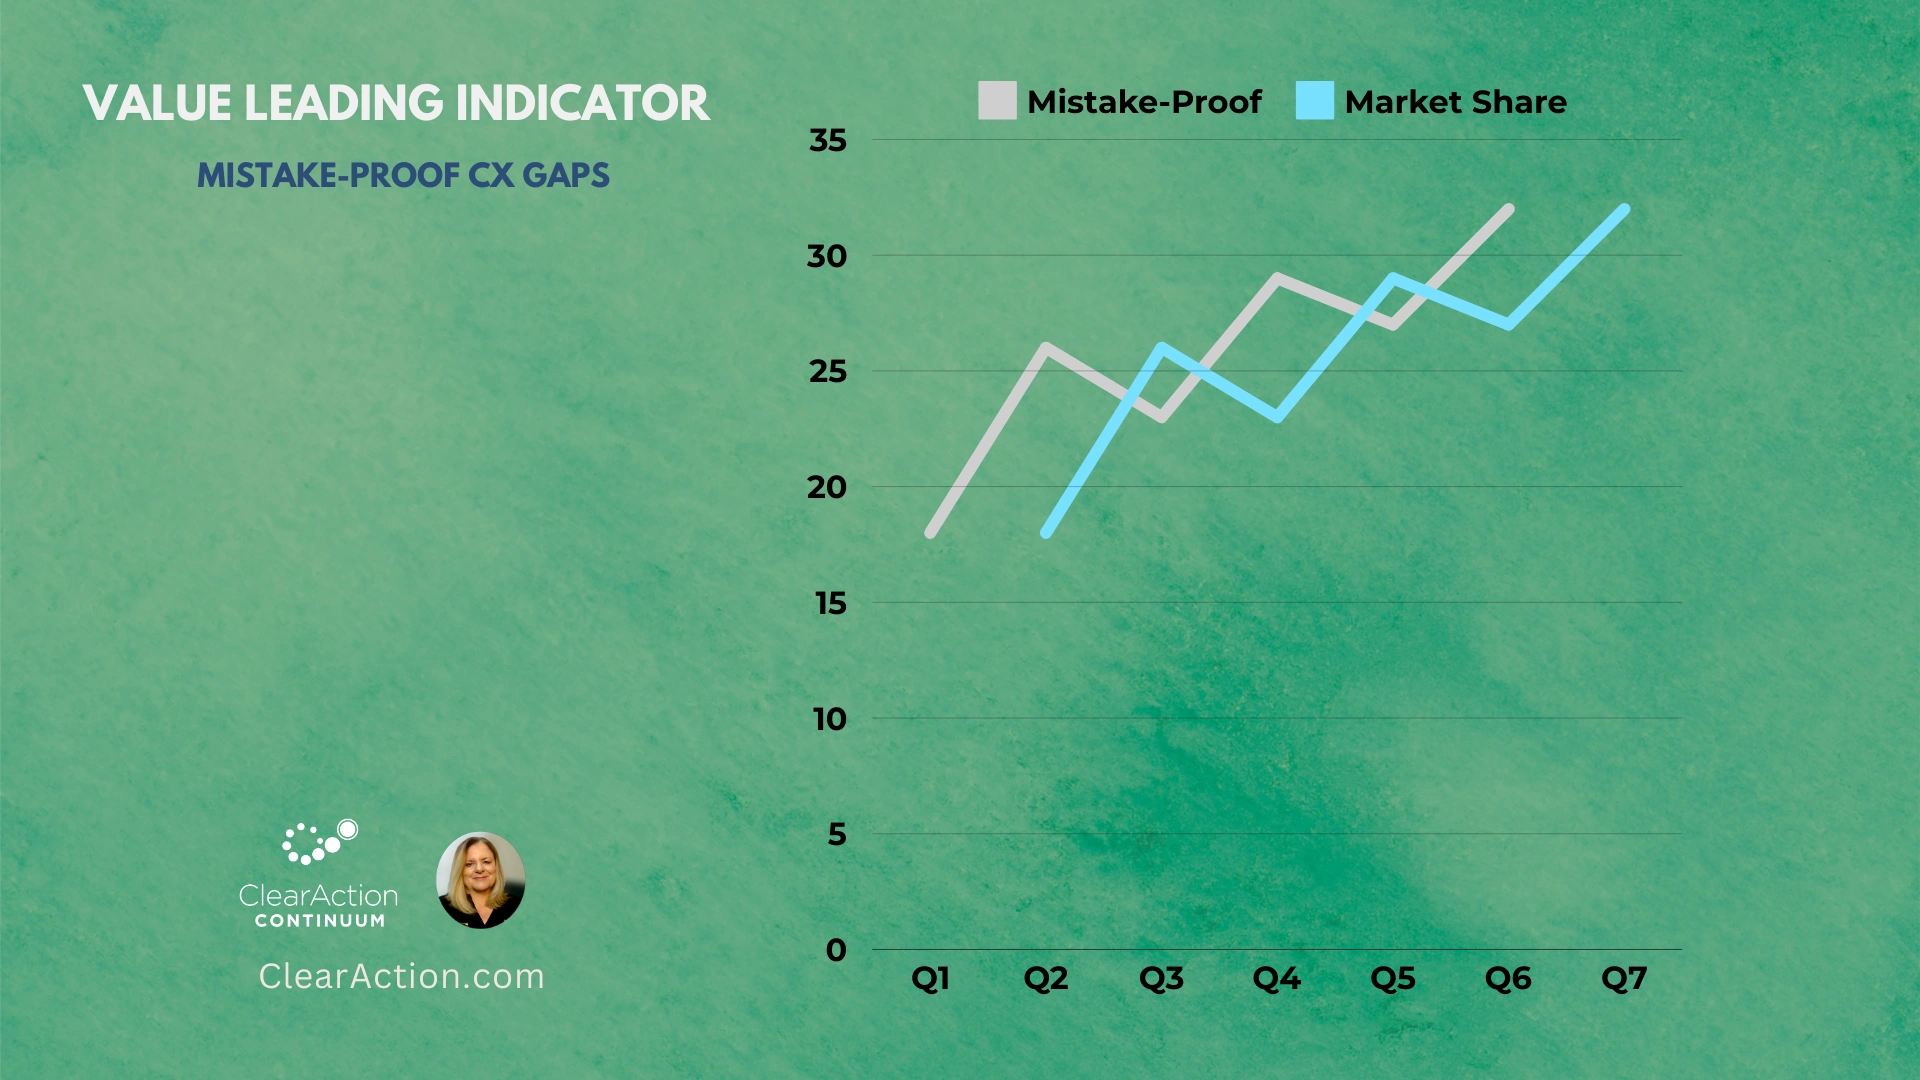
Example: Vodafone tracked their internal progress (leading indicator) in mistake-proofing customers’ pains, as shown below.
Their market share trend (customer buying behavior = lagging indicator) followed the same pattern, with a 4-month lag.
You can explore more: (optional)
Vodafone case study
Examples of Leading Indicators:
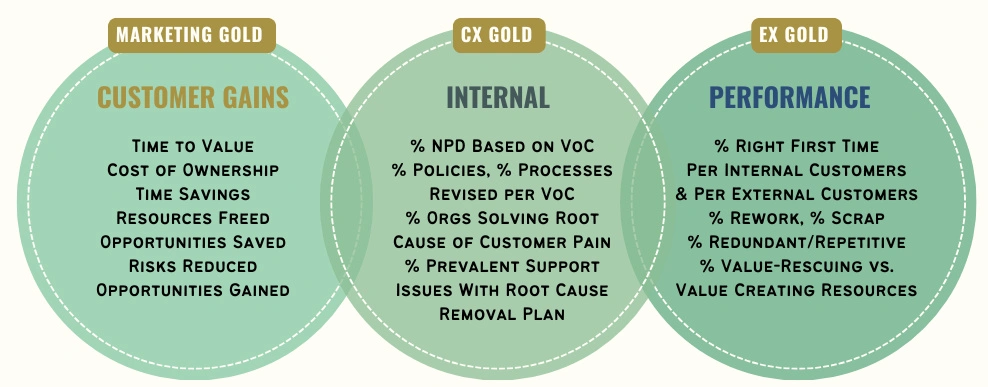
These are true leading indicators:
- Customers’ Gains
- Internal Mistake-Proofing
- Right-the-First-Time Performance
Analtyics give managers vision and urgency to drive true leading indicators.
Add your comments and questions in the Forum.

